How to Report on Search Engine Ranking in Looker Studio
Create a Looker Studio report showing organic keyword rankings over time, using free Google Search Console data.
Looker Studio (formerly Google Data Studio) is an essential part of digital marketers’ toolsets. Use it to create pretty dashboards or quickly analyze data from multiple data sources and Google Big Query. Our articles share tips and techniques for working with Looker Studio

Create a Looker Studio report showing organic keyword rankings over time, using free Google Search Console data.

Tracking conversions based on session duration isn’t possible out-of-the-box with GA4. Use this JavaScript and Tag Manager solution to build a custom event.

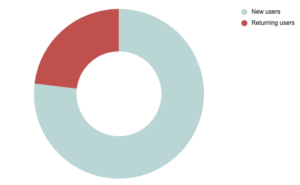
A simple pie chart comparing new & returning users from GA4 data is actually not straightforward in Looker Studio. We share ninja techniques to build it.

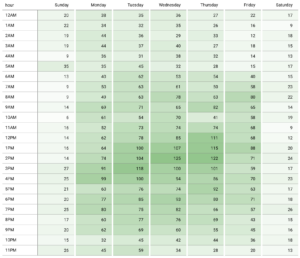
GA4’s reporting for hour of day & day of week is limited. Learn how to create an easy-to-read chart in Looker Studio & a little about BigQuery along the way.

In this Looker Studio tutorial, we explain how to use the Extract Data connector in Looker Studio to overcome the dreaded GA4 Quota Error.

Blends are one of the most powerful features in Looker Studio, but they’re a little tricky to get your head around. Learn why and how to use blends.

Copyright 2024 Two Octobers® LLC